On this page
- What is energy hedging?
- What separates a true hedge from a speculative position?
- How do futures, swaps, and options compare as hedging instruments?
- Why does basis risk prevent perfect hedges?
- How do hedging strategies work in oil, gas, and power?
- How are hedge ratios set in practice?
- How does hedge accounting affect instrument choice?
- How does regulation shape energy hedging?
- Key takeaways

What is energy hedging?#
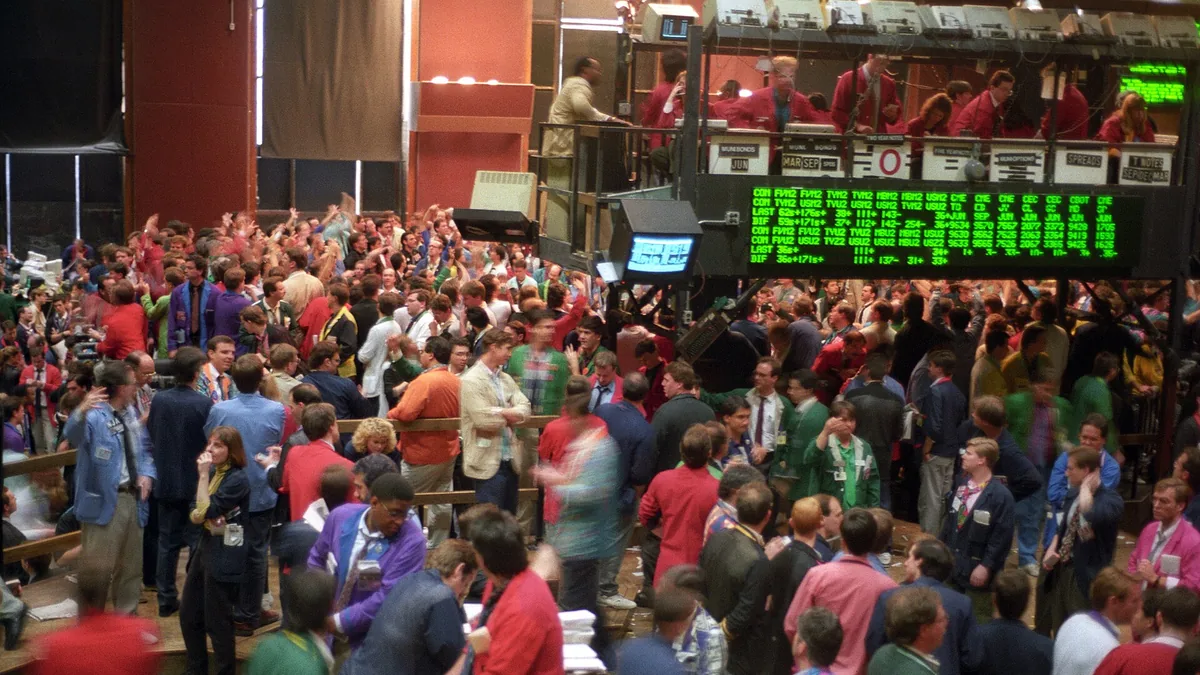
Energy hedging is the practice of offsetting the price risk of a physical position, such as a cargo, a term contract, or a power purchase agreement, with a financial instrument such as a futures contract, a swap, or an option. The instrument does not need to match the physical deal perfectly, but every mismatch leaves residual risk, called basis risk, that must be measured before deciding how much to hedge and at what ratio.
This article walks through the three main instruments, how basis risk behaves in oil, gas, and power, and how hedge ratios are set in practice, with worked examples using realistic numbers.
If you are new to how physical and paper positions interact, our guide on how commodity trading works and the comparison of physical vs paper trading cover the foundations this article builds on.
What separates a true hedge from a speculative position?#
A true hedge is a financial position whose profit and loss moves opposite to the physical exposure it protects. For example, a gas distributor holding winter supply that has not yet sold is hurt by falling prices; the distributor hedges by selling futures or buying puts so that a price decline produces an offsetting paper gain. The purpose is not to make money on the paper leg. The purpose is to stabilize the combined margin.
Two distinctions matter before choosing an instrument:
- Direction of exposure. Long physical (you own or must buy) means you sell futures or buy puts. Short physical (you must deliver or have committed volumes) means you buy futures or buy calls.
- Fixed versus floating. Most industrial exposures are floating: costs or revenues move with a market index. Hedging converts floating to fixed (or to a bounded range) so budgets, loan covenants, and margin calls stay manageable.
A common failure mode is treating the hedge book as a profit center. Once a desk is incentivized on paper P&L alone, positions drift from hedges into prop trades, and the firm discovers too late that physical and paper exposures no longer offset. Discussed further below, hedge accounting and governance exist largely to prevent this drift.
How do futures, swaps, and options compare as hedging instruments?#
Energy hedging uses three main instruments: exchange-traded futures, over-the-counter swaps, and options such as caps, floors, and collars. Futures and swaps fully fix a price but carry daily margin or periodic settlement cash flows; options bound the price while retaining part of the favorable tail in exchange for an up-front premium. The right choice depends on liquidity, credit and operational burden, and how closely the instrument matches the physical exposure.
| Parameter | Futures | Swap | Options (cap / floor / collar) |
|---|---|---|---|
| Typical venue | Exchange (ICE, CME, EEX) | OTC, cleared or bilateral | OTC or exchange-listed |
| Cash flow | Daily margin (variation) | Periodic settlement of net difference | Premium paid up front (or net zero for collars) |
| Price outcome | Fully fixed | Fully fixed | Bounded, retains some upside |
| Credit/ops burden | Margin calls, clearing member | ISDA/CSA terms, possible clearing | Premium, and margin on sold legs |
| Best suited for | Liquid exposures, tight physical match | Illiquid or customized exposures, location/product basis | Budget certainty with upside participation |
| Main risk if physical changes | Over-hedge you must unwind at a loss | Same, plus counterparty administration | Premium forfeiture if market never moves |
Futures#
Exchange-traded futures are the default tool where liquidity exists: Brent and WTI crude, NYMEX natural gas (Henry Hub), TTF and NBP gas in Europe, and power futures on exchanges such as EEX and ICE Endex. The main operational cost of futures hedging is not fees but margin: a hedge that gains or loses tens of millions in value over its life posts daily variation margin, which ties up working capital even when the overall combined position is safe. This is why credit lines and clearing arrangements, including instruments covered in our piece on letters of credit in commodity trade finance, are part of hedging design, not an afterthought.
Swaps#
A swap converts a floating price into a fixed price (or vice versa) with no exchange of principal. An oil consumer might agree with a bank to pay a fixed $85.00/bbl on a notional volume of Brent and receive the floating monthly average. Each month the two legs are netted and one side pays the difference. Swaps dominate where the exposure is an average price (Platts or Argus assessments, monthly indices) rather than a single closing print, which is the norm for physical crude and products. Swaps are also the natural tool for basis hedging, because they can be written on any index a counterparty will quote, even if liquidity is thin and bid-offer spreads are wide.
Options#
Energy hedgers rarely buy naked calls and puts in the textbook sense. They buy caps (a strip of calls, limiting a buyer’s maximum purchase price), floors (a strip of puts, protecting a seller’s minimum sale price), and costless collars (buying one, selling the other, so the net premium is zero but the range is bounded on both sides). The premium decision is the real negotiation: a one-year Henry Hub at-the-money cap can cost a meaningful fraction of the underlying notional, so hedgers routinely sell out-of-the-money options on the other side, accept a worse floor, or use Asian-style options that settle on averages and are cheaper because averages are less volatile than discrete fixings.
Why does basis risk prevent perfect hedges?#
Basis risk is the residual exposure left when a hedging instrument does not move one-for-one with the actual physical price. Every real-world energy hedge carries some basis risk, arising from location, timing, product, and delivery-shape mismatches between the hedge and the physical position. Because basis risk cannot be eliminated, hedgers must measure it before deciding how much of an exposure to hedge and at what ratio.
The sources are consistent across commodities:


- Location basis. Hedging Baltic deliveries with TTF, or Midland crude with WTI at Cushing. Pipeline congestion, transport costs, and local supply shocks cause the spread to move independently of the flat price.
- Timing basis. Your exposure settles daily or on a lift date; the future settles on a monthly average, or in a different month. Calendar spread risk in gas and power is often larger than flat-price risk itself.
- Product basis. Hedging jet fuel with gasoil, fuel oil with Brent, or a specific coal quality with a generic index. The hedge tracks the benchmark, not your molecule.
- Quality and shape. Power exposures depend on hour-by-hour shape (peak vs off-peak, hours around the clock), which monthly base-load futures do not capture.
How does basis risk appear even in a near-ideal hedge?#
A practical example: a Nordic utility sells baseload power for Q1 at a fixed price to an industrial customer, and hedges by selling Q1 Nordic base-load futures. Even this near-ideal hedge carries basis risk: the customer may offtake in a peak-heavy profile, water conditions may compress Nordic prices relative to German futures, and the customer may default on volume. The utility has hedged flat price but still owns shape and volumetric risk.
How do you quantify basis risk with a hedge ratio?#
Basis risk is handled through the hedge ratio, the fraction of the physical exposure you cover. The textbook minimum-variance ratio is:
h* = Cov(ΔP_physical, ΔF_hedge) / Var(ΔF_hedge)
where the deltas are changes over the same period. In words: how many euros of hedge move do you need per euro of physical move. If your local price historically moves 0.8 units for every 1 unit of the benchmark, and the correlation is imperfect, the optimal ratio comes out below 1.
Worked example for gas. A Baltic buyer consumes 500 GWh annually, priced against a local index that trades on average 0.90 EUR/MWh higher than TTF, with a standard deviation of the TTF-Baltic spread of 1.50 EUR/MWh and a TTF annual volatility of 12 EUR/MWh. Running the covariance math (spread volatility relative to hedge volatility, and correlation around 0.99), the minimum-variance ratio works out near 0.98, so the buyer hedges roughly 490 GWh of TTF, not 500, and accepts about 1.5 EUR/MWh of unhedged residual spread risk. The point of the exercise is not the precise number but the discipline: you size the hedge to the statistical relationship, monitor the spread, and adjust when the relationship shifts.
How do hedging strategies work in oil, gas, and power?#
Hedging strategies differ across oil, gas, and power because each market exposes participants to a different mix of basis risks. An airline hedges jet fuel with Brent crude futures at a reduced hedge ratio, a gas producer locks in winter sales with TTF futures or swaps while managing margin calls, and a power consumer layers baseload futures with peak products to cover hourly shape. In each case the hedge is sized to the statistical relationship between instrument and exposure.
How does an airline hedge jet fuel with crude?#
An airline must buy 10 million barrels of jet fuel over the next year. No liquid jet futures exist at scale, so it hedges with Brent. Historical analysis shows jet in northwest Europe trades around a stable crack to Brent but with spread volatility.
Plan: sell 10 million barrels of Brent monthly futures over twelve months. Because the jet-Brent crack widens when crude falls (refining margins tend to strengthen), the crude hedge is slightly under-sized, say a ratio of 0.9, or 9 million barrels. If Brent falls $10/bbl over the period, the airline saves roughly $90 million on its crude purchases, offsetting most of the paper loss. If the crack also widens $2/bbl, the physical jet cost falls less than crude did, and the under-hedge is what limits over-compensation. Many airlines instead buy cap structures on Brent to keep some benefit from low prices; the premium outlay is a board-level decision because it visibly reduces earnings in benign years.
How does a gas producer lock in winter sales?#
A small producer will deliver 5 TWh into a European hub over Q1 and sells a strip of quarterly TTF futures at 32 EUR/MWh. Two months later TTF trades at 40. The paper leg shows a large mark-to-market loss and posts variation margin, while the physical gas, now worth more, is sold at the higher spot. The firm’s treasury function must survive the cash-flow mismatch: this is where futures hedging fails operationally even when it works economically. Producers in thin markets often prefer swaps against monthly averages or floors plus a share of upside, accepting a lower guaranteed price to avoid the margin path.
How does a data center hedge a power load profile?#
A data-center operator consumes 200 MW around the clock and wants 2026 budget certainty. Monthly base-load futures hedge flat price but leave hourly shape risk, because its consumption peaks in system peak hours when spot is highest. Standard practice is to layer:
- Sell/hedge the annual baseload volume with annual and quarterly base-load futures or swaps (80 to 100 percent of the volume).
- Add peak products or a shape swap to cover the difference between its peak-heavy profile and baseload.
- Leave the final few percent unhedged, or use collar structures, to preserve flexibility if load changes.
Power hedging fails most often on volume: if the operator builds a second facility mid-year, the hedge book is suddenly short physical against the paper, an unplanned speculative position that must be unwound or extended.
How are hedge ratios set in practice?#
In practice, hedge ratios are set by policy rather than by statistics alone. Beyond the minimum-variance estimate of covariance over hedge variance, the ratio a firm actually uses depends on its hedging objective, tenor policy, volumetric tolerance, and capacity to fund variation margin. Typical corporate policies hedge a rolling 80 to 100 percent of near-term exposure and progressively smaller fractions further out.
The policy answers questions the math does not:


- What is the hedging objective? Stabilize margin for lenders (lean toward high ratios, 80 to 100 percent on a rolling basis) versus protect downside but keep upside (50 to 75 percent, layered over time).
- What is the tenor policy? Most corporates hedge a rolling percentage: for example 80 percent of the next 12 months, 50 percent of months 12 to 24, and nothing beyond, re-stripping each quarter. This avoids locking the worst price of the cycle and avoids gambling on the best.
- What is the volumetric tolerance? If physical volumes can swing 20 percent (weather-driven gas demand, variable industrial load), a 100 percent paper hedge converts volume risk into price risk whenever volumes fall.
- Can you fund the margin path? A hedge ratio of 100 percent on futures requires committed credit lines sized to the worst plausible cash-flow scenario before settlement.
What does a simple layered hedging policy look like?#
A workable default for an industrial energy buyer:
| Horizon | Hedge fraction (percent) | Instruments |
|---|---|---|
| 0 to 6 months | 80 to 90 | Futures or swaps against the primary index |
| 6 to 12 months | 60 to 75 | Swaps plus partial caps |
| 12 to 24 months | 40 to 50 | Swaps, costless collars |
| Beyond 24 months | Opportunistic | Options only, given premium cost |
Layering means adding increments each month rather than hedging the whole period at once, which averages entry points and reduces regret.
How does hedge accounting affect instrument choice?#
Hedge accounting under IFRS 9 changes what a firm can claim on its financial statements. Hedge accounting requires a documented relationship between the hedging instrument and the exposure, with effectiveness measured prospectively and retrospectively, typically within an 80 to 125 percent historical dollar-offset band. When basis risk is large, the hedge may fail effectiveness testing, and the paper P&L lands in earnings while the physical offset sits in inventory.
The result is reported volatility that the economics do not have. This is a major reason firms sometimes choose options (premium is the whole cost) over futures (path volatility flows through earnings).
How does regulation shape energy hedging?#
Regulation shapes which hedging instruments are available to energy firms and how they must be documented. EU energy firms face position limits, reporting obligations, and market-abuse rules under REMIT for power and gas, plus derivative reporting under EMIR. Swiss counterparties trading with EU entities face parallel obligations under the Swiss FinfraG regime. None of these rules changes the economics of a hedge, but they change documentation, clearing obligations, and whether a bilateral swap is even available to you.
Our comparison of EMIR vs MiFID II for energy traders covers the EU derivative reporting regime in detail, and our FinfraG overview covers the Swiss regime.
Key takeaways#
- Futures and swaps fix a price and remove both tails; options bound the price and keep part of the favorable tail, at premium cost.
- Every real hedge carries basis risk from location, timing, product, and shape; measure the historical relationship before sizing anything.
- Hedge ratios are covariance over hedge variance, but the ratio you actually use comes from your tenor policy, volume tolerance, and margin capacity.
- Layer hedges in tranches across time rather than fixing the whole exposure at one price.
- Judge hedge performance against the combined physical-plus-paper margin, never against the paper leg alone, and keep governance that prevents the book drifting into speculation.
- Cash-flow survivability (variation margin, credit lines) is as decisive as price analysis; a hedge that is correct on paper can sink a firm on cash flow.
Key concepts
More in Risk & Derivatives Glossary of key terms
Frequently asked questions
What is the difference between hedging with futures, swaps, and options?
Futures and swaps lock in a fixed price and remove downside but also upside. Options (typically caps and collars) protect against adverse moves while keeping some participation in favorable ones, in exchange for a premium or a sold offset leg.
What is basis risk in energy hedging?
Basis risk is the residual exposure left when the hedging instrument does not move one-for-one with the physical price you actually buy or sell. It arises from location, timing, product quality, or index differences, such as hedging Baltic gas with TTF futures.
What is a hedge ratio and how is it calculated?
A hedge ratio is the volume of the hedging instrument divided by the physical exposure. The minimum-variance ratio is estimated as covariance of physical and hedge price changes divided by the variance of hedge price changes, often close to the basis correlation squared in practice.
Why can a hedger lose money on a hedge and still call it a success?
Because a hedge is judged against the physical result, not in isolation. If a refining or trading margin was protected as intended, losses on paper positions are the cost of predictability, not a failed trade.